Thanks for the speedy reply!
I’ve tried the beta update–happy to report scanning is indeed significantly faster.
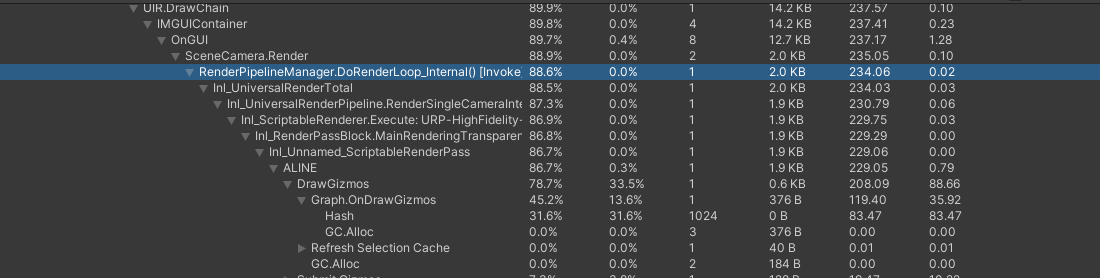
However there’s still a pretty significant slowdown on the gizmos drawing in the scene view.
If I disable “Show Graphs” entirely via the widget int he lower right of the scene view everything is fine. However if I turn off all the toggles in the inspector of the Pathfinder component despite nothing being rendered it’s still quite slow (something in memory maybe?).
I think I saw somewhere in another forum thread maybe that 1000x1000 grid is reaching pretty far for what you may have intended? If that’s the case then I might just need to rethink my usage here entirely (and maybe go to a nav mesh).
After a bit of time these errors did start popping off in the console every update if it helps any:
Assertion failed
UnityEngine.GUIUtility:ProcessEvent (int,intptr,bool&)
ArgumentNullException: Value cannot be null.
Parameter name: value
UnityEngine.MaterialPropertyBlock.SetTexture (System.Int32 nameID, UnityEngine.Texture value) (at <c2d036c16ca64e0eb93703a3b13e733a>:0)
UnityEngine.Rendering.Blitter.BlitTexture (UnityEngine.Rendering.CommandBuffer cmd, UnityEngine.Rendering.RTHandle source, UnityEngine.Vector4 scaleBias, UnityEngine.Material material, System.Int32 pass) (at ./Library/PackageCache/com.unity.render-pipelines.core@14.0.8/Runtime/Utilities/Blitter.cs:261)
UnityEngine.Rendering.Universal.Internal.CopyDepthPass.ExecutePass (UnityEngine.Rendering.ScriptableRenderContext context, UnityEngine.Rendering.Universal.Internal.CopyDepthPass+PassData passData, UnityEngine.Rendering.CommandBuffer& cmd, UnityEngine.Rendering.Universal.CameraData& cameraData, UnityEngine.Rendering.RTHandle source, UnityEngine.Rendering.RTHandle destination) (at ./Library/PackageCache/com.unity.render-pipelines.universal@14.0.8/Runtime/Passes/CopyDepthPass.cs:186)
UnityEngine.Rendering.Universal.Internal.CopyDepthPass.Execute (UnityEngine.Rendering.ScriptableRenderContext context, UnityEngine.Rendering.Universal.RenderingData& renderingData) (at ./Library/PackageCache/com.unity.render-pipelines.universal@14.0.8/Runtime/Passes/CopyDepthPass.cs:103)
UnityEngine.Rendering.Universal.ScriptableRenderer.ExecuteRenderPass (UnityEngine.Rendering.ScriptableRenderContext context, UnityEngine.Rendering.Universal.ScriptableRenderPass renderPass, UnityEngine.Rendering.Universal.RenderingData& renderingData) (at ./Library/PackageCache/com.unity.render-pipelines.universal@14.0.8/Runtime/ScriptableRenderer.cs:1490)
UnityEngine.Rendering.Universal.ScriptableRenderer.ExecuteBlock (System.Int32 blockIndex, UnityEngine.Rendering.Universal.ScriptableRenderer+RenderBlocks& renderBlocks, UnityEngine.Rendering.ScriptableRenderContext context, UnityEngine.Rendering.Universal.RenderingData& renderingData, System.Boolean submit) (at ./Library/PackageCache/com.unity.render-pipelines.universal@14.0.8/Runtime/ScriptableRenderer.cs:1446)
UnityEngine.Rendering.Universal.ScriptableRenderer.Execute (UnityEngine.Rendering.ScriptableRenderContext context, UnityEngine.Rendering.Universal.RenderingData& renderingData) (at ./Library/PackageCache/com.unity.render-pipelines.universal@14.0.8/Runtime/ScriptableRenderer.cs:1222)
UnityEngine.Rendering.Universal.UniversalRenderPipeline.RenderSingleCamera (UnityEngine.Rendering.ScriptableRenderContext context, UnityEngine.Rendering.Universal.CameraData& cameraData, System.Boolean anyPostProcessingEnabled) (at ./Library/PackageCache/com.unity.render-pipelines.universal@14.0.8/Runtime/UniversalRenderPipeline.cs:650)
UnityEngine.Rendering.Universal.UniversalRenderPipeline.RenderSingleCameraInternal (UnityEngine.Rendering.ScriptableRenderContext context, UnityEngine.Camera camera) (at ./Library/PackageCache/com.unity.render-pipelines.universal@14.0.8/Runtime/UniversalRenderPipeline.cs:534)
UnityEngine.Rendering.Universal.UniversalRenderPipeline.Render (UnityEngine.Rendering.ScriptableRenderContext renderContext, System.Collections.Generic.List`1[T] cameras) (at ./Library/PackageCache/com.unity.render-pipelines.universal@14.0.8/Runtime/UniversalRenderPipeline.cs:376)
UnityEngine.Rendering.RenderPipeline.InternalRender (UnityEngine.Rendering.ScriptableRenderContext context, System.Collections.Generic.List`1[T] cameras) (at <c2d036c16ca64e0eb93703a3b13e733a>:0)
UnityEngine.Rendering.RenderPipelineManager.DoRenderLoop_Internal (UnityEngine.Rendering.RenderPipelineAsset pipe, System.IntPtr loopPtr, UnityEngine.Object renderRequest, Unity.Collections.LowLevel.Unsafe.AtomicSafetyHandle safety) (at <c2d036c16ca64e0eb93703a3b13e733a>:0)
UnityEngine.GUIUtility:ProcessEvent(Int32, IntPtr, Boolean&)