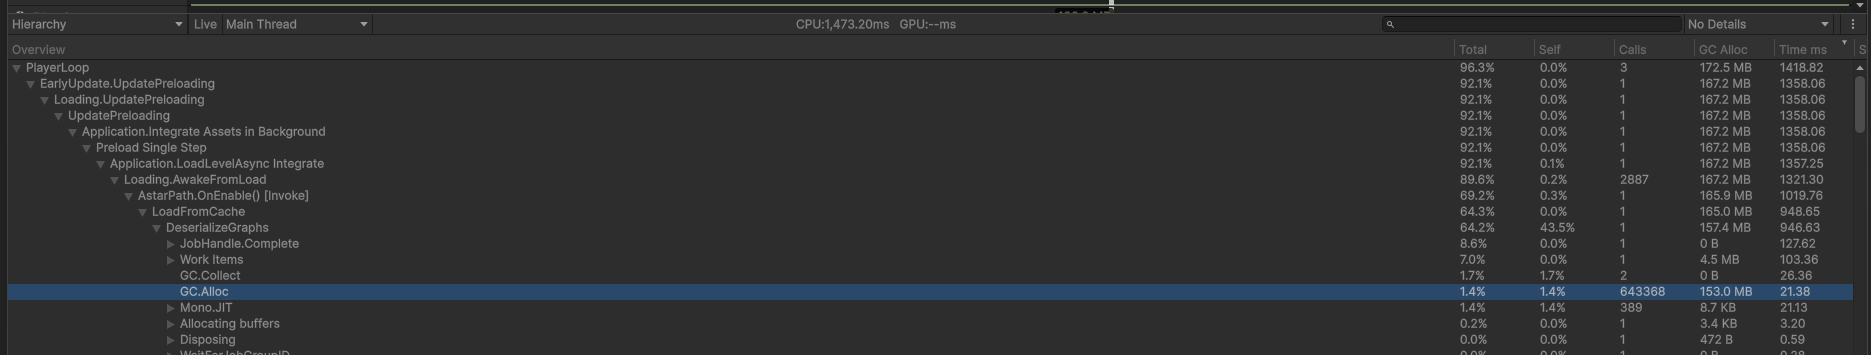
Currently doing a bit of profiling and seeing a pretty significant cost here on loading from cache that I’m not expecting.
The 643k allocations is probably the thing that seems strangest?
The graph itself is a 1k x 1k grid graph so pretty much the largest allowed and it is cached. Any suggestions on what to look at or improve here? Happy to provide more info, this seems like it’s working as intended but that many alloc calls does seem a bit suspicious. This is a recent change leading to a noticeable hiccup during initialization of the scene this profile snapshot is from.
This is on version 5.3.8 of the package on Unity 6.51f1 (updating to latest of the package and the latest LTS is on the agenda, just not there yet  )
)
Hi
A 1000x1000 grid will by itself have 1 000 000 nodes, so 643 000 allocations is actually less than I expected (possibly some are happening in a separate thread).
I don’t have any good solutions for improving this at the moment, I’m afraid, other than switching to a different graph type (e.g. recast) which will likely require vastly less memory to represent the same level. The loading code’s main cost is just allocating all the 1 million nodes.
Ok, appreciate the response. The size of the graph hasn’t really changed in months (also I double checked and it’s really closer to 800k nodes) but this performance problem only really recently appeared.
Going to see if just scanning it again at runtime is faster anyway, in editor it’s a very fast scan–we scan the terrain in editor but runtime populates it at random essentially (and we update the node connections manually, don’t rescan).
I’d love to get us to a recast graph with the latest version of the package as well–the new system for penalties looks like a good match (we needed cell by cell fidelity on it previously).