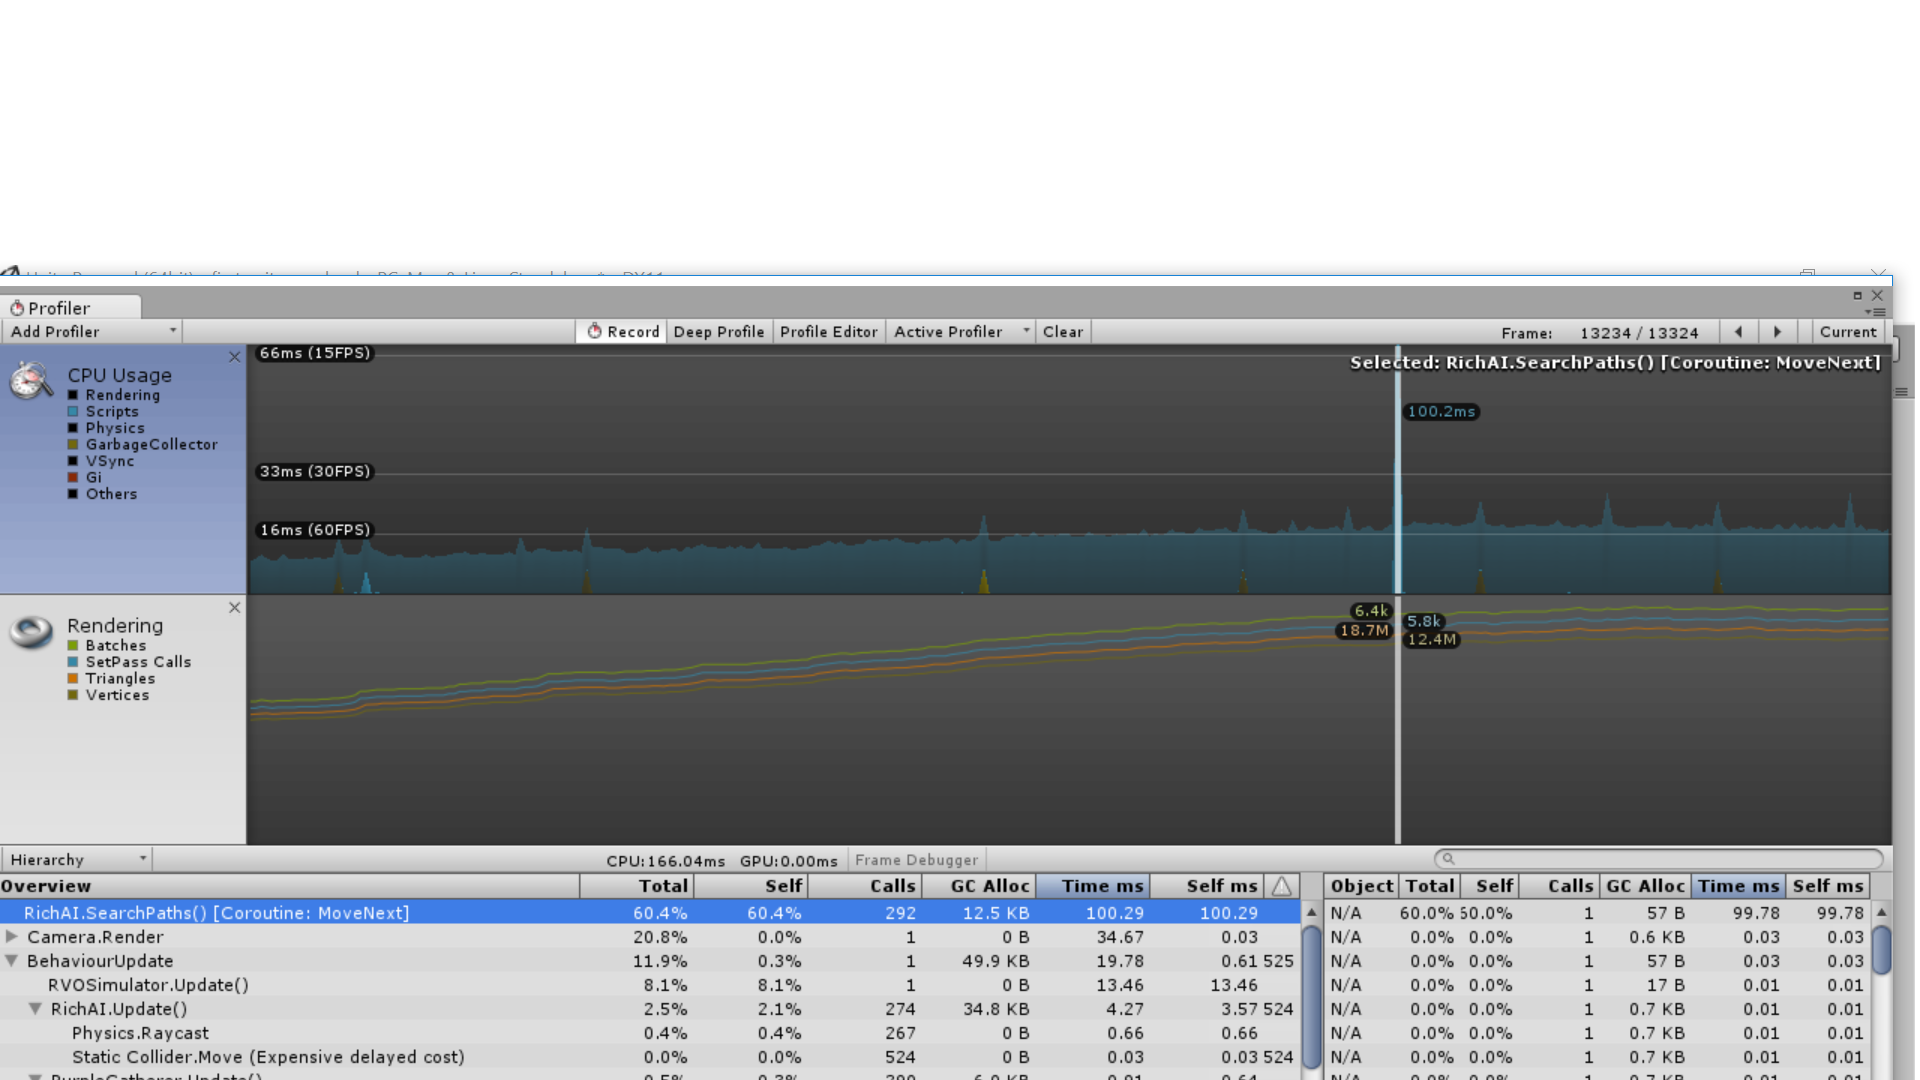
As I’m looking at what’s most expensive when using this solution two things are standing out and I was hoping to get some advice on what I might do to minimize the problem. The first is that I am getting spikes in the profiler from RichAI.SearchPaths() [Coroutine Move Next]. I get these even when there are only a few agents and they can be 10 to 20 ms hits. WHen these spikes happen with 200 or 300 agents then it can be a 100ms hit. They are less frequent then the GC.Collector spikes which are very regular.
I guess what I am looking for is what might be causing these two issues and what the best practice is in avoiding it. Also in the future should I make two posts for these types of questions?
What version of the package are you using?
In 3.8 a bug was fixed which could cause performance problems when lots of agents recalculated their paths often.
…Though it doesn’t really look like it should be caused by that. It looks like a single unit is causing the huge spike. I am not really sure what could be the cause of that since the SearchPaths method barely does anything…
I am using the rvo beta version. And I get these spikes when there are only a few agents, though they are far worse the more agents there are. It is it a pretty small space (a 6x6 recastgraph on a flat plane) as I am stress testing.
I am also curious about the garbage collection, is there anything I can do to reduce those calls?
Hi there,
i have the same issue in my Project. Its an old Thread, but maybe someone found a solution for this ?
Iam also looking to reduce the garbage colection calls.