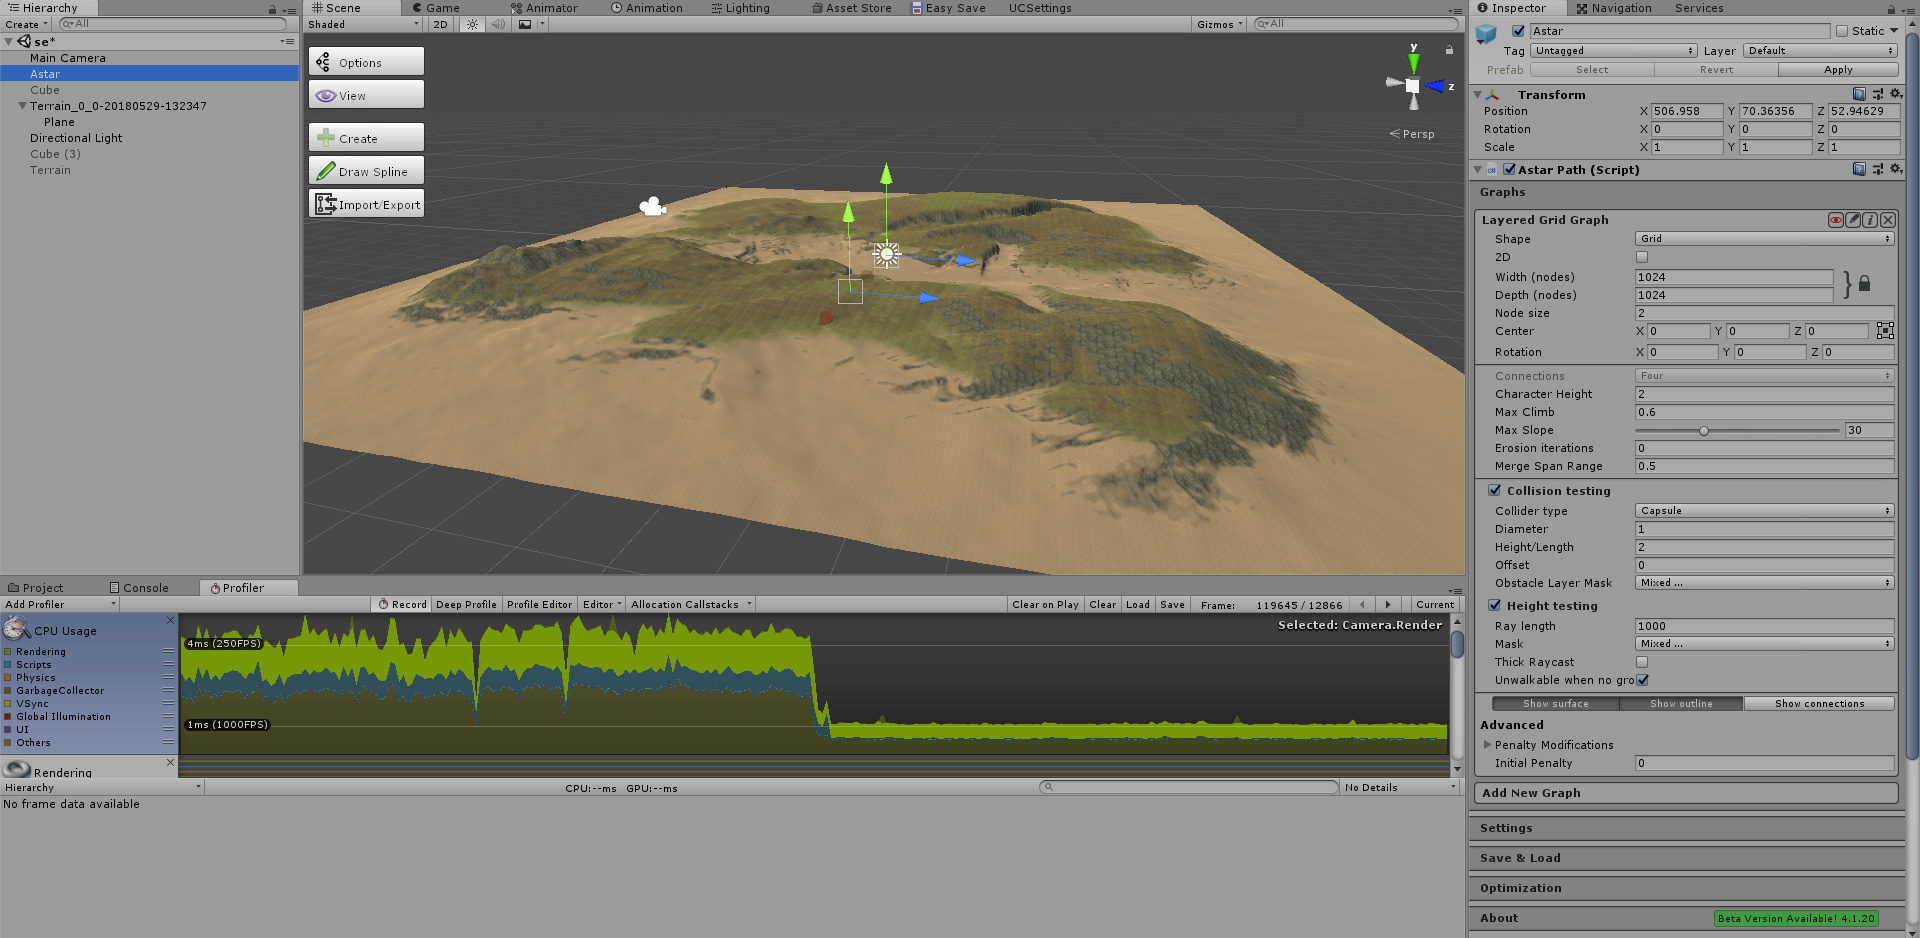
Hello, I have a weird problem with updating a graph at runtime. Here’s a screenshot of the profiler and the astar settings.

This is the code called at runtime, when some object gets destroyed, I need to update the graph:
Bounds astarBounds = new Bounds (transform.position,new Vector3 (range,range,range));
AstarPath.active.UpdateGraphs (astarBounds,2);
No matter what the range parameter is for the bounds of the update, 1,10 or 100, the lag spike is exactly the same. It happens both in editor and in a runtime build, so although the editor and profiler overhead go away at build time, the camera.render processing doesn’t. I’m using 4 worker threads and a maxed out layered grid graph. I also tried batching and that didn’t change anything either.
Why is the profiler saying that the lag is caused by Camera.render? I disabled anything related to visualization with astar as you can see in the screenshot to the right.
Hi
In editor mode, the only significant thing that this package does in Camera.Render is recalculating graph gizmos, which may be expensive. However if you have ‘Show Graphs’ disabled, it should not cause any issues.
In a standalone player there is nothing in my package that I can think of that would show up in Camera.Render. Can you dig deeper into the profiler to see where the spike is coming from?
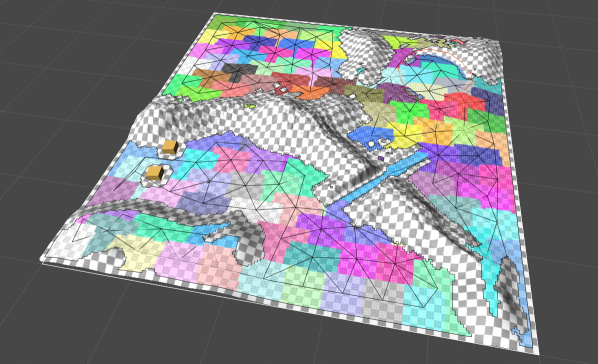
Here are some more pics:


Last picture is the profile of a normal frame. It doesn’t make sense for Astar to affect the camera.render, but it does! I made sure to try destroying an object with and without updating the graph. My scene is pretty complex, but I also tried it in a scene with only a dozen other renderers and the same big terrain, with no details or trees and the spike is almost the same, but not as bad. In the empty scene, a normal frame takes 2.5ms to draw and in the spike it takes 5.4ms
Edit: It won’t let me put more than 2 pictures, but in the first picture, both ‘drawing’ and culling’ take a little more than 4ms each and generally every other line has increased compared to a normal frame
I did some more digging… I put some Debug.Logs in
public bool ProcessWorkItems (bool force)
in the WorkItemProcessor and kept track of the current frame to see when calculations end and begin. For simplicity, I used only one thread. These are the results:
The process begins work on frame 3020 and ends on frame 3135. The big lag starts at frame 3078.
I experimented a bit with that method… if I turned it off, there’d be no lag but also the graph wouldn’t get updated of course. I wonder why there is a delay between when the process starts the work at frame 3020 and the big rendering lag doesn’t actually begin until 3078. I’ll continue experimenting with that method since it looks like that’s the culprit.
The best conclusion I can come up with is that for some reason, the whole scene is being force rendered while the update computation is being done. It also calls ‘Physics.UpdateBodies’, which it looks like it updates all the rigidbodies in the scene during the spike. It’s like Unity detected a change in a static body and needs to recompute the whole scene.
Edit: Excuse me, why were my posts hidden? What’s so ‘spammy’ about them?
Well, after some hours spent on it… I figured out when this happens. I don’t know if this is a Unity bug or an Astar bug, but this ONLY happens when the terrain is big and deformed.
I spent several hours thinking it’s the trees at first, then water then other renderers… until I got down to the very basic and made a naked terrain using Gaia. With a terrain that’s flat or barely deformed, this bug doesn’t happen at all, but the one you see in the picture somehow gets its cache reset or something and has to be rendered and have its physics reset as if the scene just loaded. I don’t know what to do and how to fix it.
So Aron, if you want to reproduce the bug, use a 2x2km terrain, deform it to make it look realistic with hills and use a Layered Grid Graph. Then try updating the graph at runtime and you’ll get the same spikes.
Does anyone have any ideas on how to fix this? I can’t use the normal Grid graph as I need Layers to be able to nagivate through multiple floors.
Huh. I have no idea. That seems really strange. The only thing my package queries from the terrain is via the physics system using raycasts and similar things. Maybe some weird extreme case in the physics engine?
It’s weird because it seems to be happening with Layered Grid graphs, but not with Recast graphs which I’m currently using for my large terrain. I’d much prefer the layered grid because it’s much faster for the precision I need.
Hey @aron_granberg I now have a pretty good idea of what’s going on now.
The Layered grid graph has a method called FloodFill and it takes an obscene amount of time to update, causing the lag spikes on a maxed out 1024x1024 graph. I tried disabling it but of course, the modified nodes will be in an area of their own. So even though the graph updates correctly with no lag spike, it’s pretty much useless if it doesn’t connect the newly created nodes with the ones nearby. So I wonder, why does the algorithm need to update every single node in the graph in order to link a small area? Your ‘updateGraphs’ method can update a layered grid graph in a small bounded area so surely it should also be able to link to other nodes in that same area without having to go through the whole graph right?
Oh, and the reason why it didn’t show in the profiler was because this work is done in other threads and since those threads are crazy busy, Unity takes longer to render, calculate physics and everything else it does normally. I managed to isolate it by doing all the work in the main unity thread.
I guess my main question is, can the algorithm be improved for floodfilling? I’m thinking the obvious solution would be to just go through the nodes in the specified bounds but then again, I don’t know anything about this stuff.
1 Like
Hey, a couple of quick thoughts from someone browsing on potentially gathering more info:
- Does enabling AStar profiling add use of https://docs.unity3d.com/ScriptReference/Profiling.Profiler.BeginThreadProfiling.html (and CustomSampler) to the AStar threads? (perhaps it should if not?)
- If done, you might also want Deep profiling enabled to really see details. (the screenshots didn’t but then if (1) isn’t true, nothing might have shown up anyway.)
HTH
1 Like
Hi @radu392
Sorry for the late answer.
The reason it is so late however is because I have spent the last few days implementing a new optimization for how the areas are calculated which I have been thinking about for some time (long before this thread). It turned out to be trickier than I thought from the beginning, but it worked out well in the end.
The reason it cannot be done quickly using a somewhat naive algorithm is because in the worst case half of the graph might change its area value.
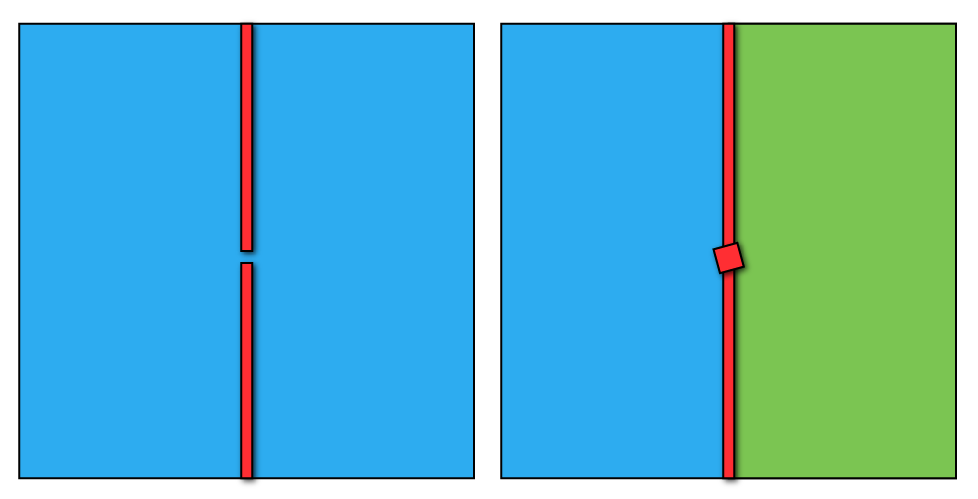
Let’s say we have a graph like on the left side in the image below. It has a few thin obstacles in the middle that are almost blocking off the left side of the graph from the right side. If we add a new very small obstacle just in that opening, the result is that the left side is now disconnected from the right and thus all node on either the left or right side must have their area fields updated (colored green in this case).
What I have done in the new version is to build a smaller graph which still respects the same connectivity as the larger one.
Using some tricks it is possible to update the whole graph’s connectivity very quickly using this hierarchical graph.
If you want to read more about how it works, here is the documentation page about it: https://www.arongranberg.com/astar/documentation/dev_4_1_22_b6b48779/hierarchicalgraph.html
I have uploaded a new beta (4.1.22) with these changes to https://www.arongranberg.com/astar/download. You can try it out and see if it works better.
@Arakade Oh, I haven’t noticed that API before. Seems to be new in 2017.3. I have added that to the 4.1.22 beta as well.
2 Likes