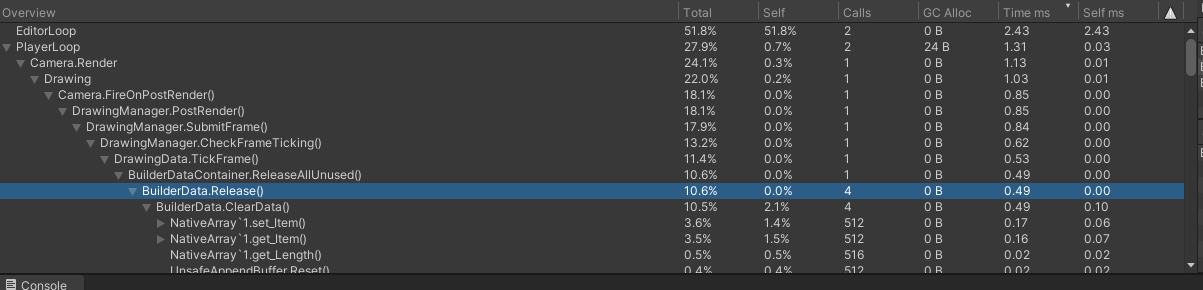
Imported ALine - create a blank scene. Noticed that TickFrame (data.ReleaseAllUnused() specifically) is hammering the framerate. When I load it into a busy scene with lots of GPU activitity it can be 20-25% of a frame.
That’s odd… Would you mind posting a screenshot of the profiler with deep profiling enabled?
Does the same thing happen if you close Unity and then open Unity again in the empty scene?
Yes it does. Same behavior after closing. I only noticed it because I was pushing the GPU hard using instanced drawing. At higher loads at higher framerates it was standing out. Attaching screen.
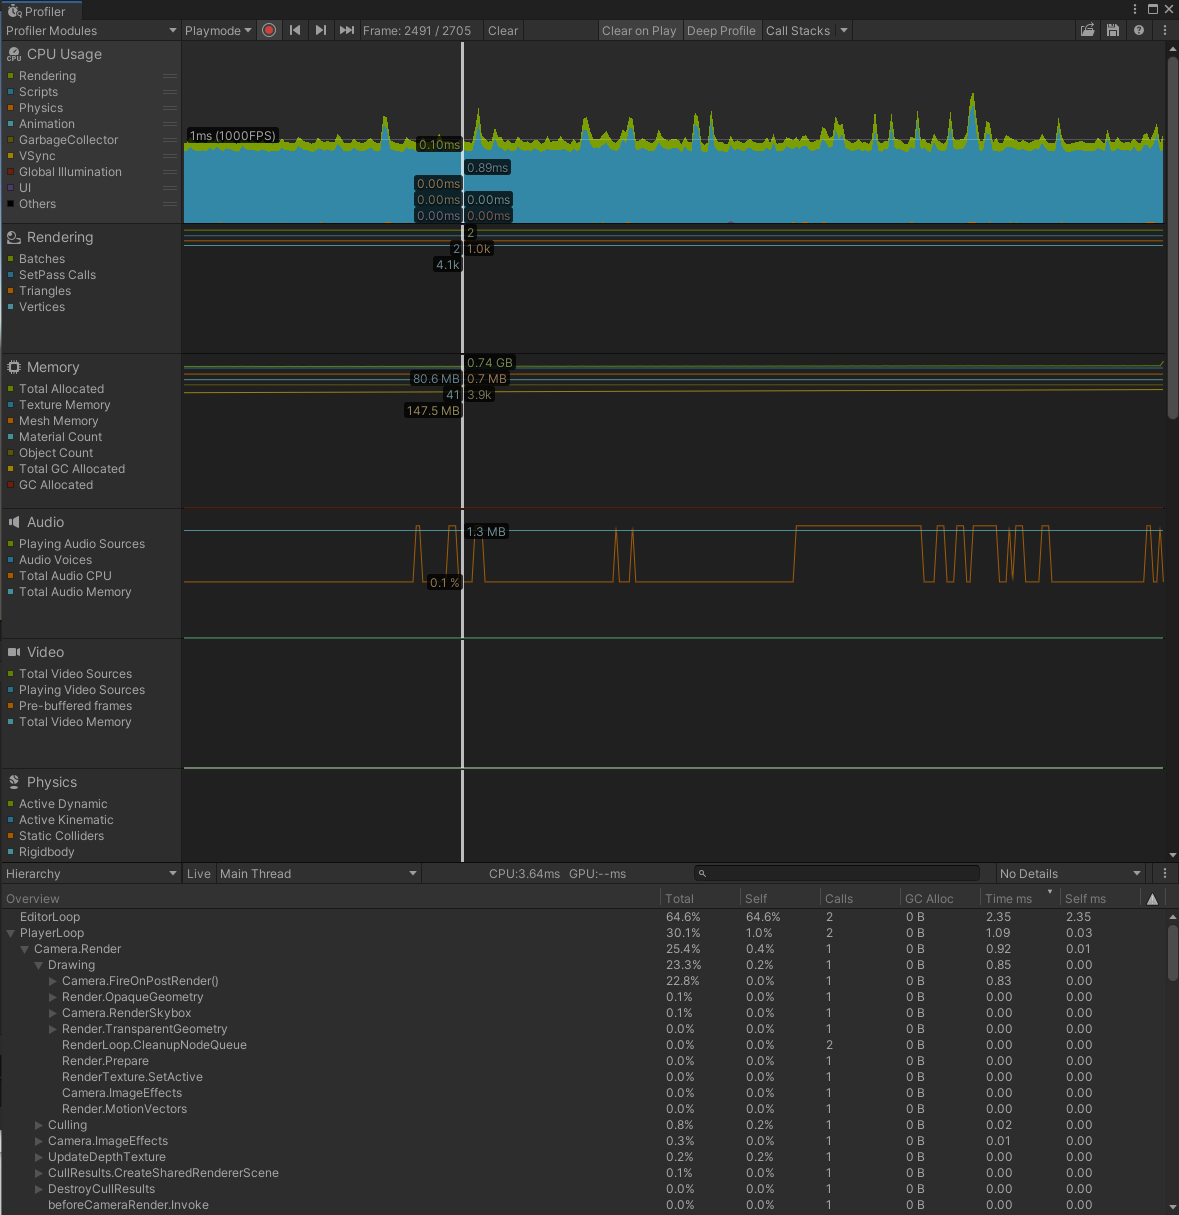
I’ve also tried it on LTS same behavior. There is (clearly in the empty scene) no use of Draw or any custom scripts. I see similar degradation in a build as well.
Would you mind expanding the profile so that I can see what takes up the time. 0.8ms for rendering per frame doesn’t sound too much since deep profiling is enabled.
You are correct. It is a small amount with deep profiling enabled. It only stuck out because I was looking at various places to improve performance overall and it was stuck at the top of the list 
I have optimized that particular part now. In a blank scene the PostRender method now takes about 0.02ms. This will be included in the next version (1.3.1) which will be released in a few days.
Awesome thank you!!!