Nope, I have no navmesh cut components in the scene currently.
Ok.
So full tile recalculations are slow. I usually do not recommend using those for real-time updates, and even so they should only be done rarely. It does the same thing as when the graph is originally scanned (but for just a single tile). This involves rasterizing all meshes inside of it.
One thing that could potentially take a long time is to convert the terrains to meshes. Currently it splits the terrain into smaller chunks, but there is no check done if each chunk will actually affect the final result (it only checks if it can skip the whole terrain instance). You can try to profile this by adding some profiling code to the RecastMeshGatherer.CollectTerrainMeshes method.
It’s not so much realtime. It’s when a tree spawns in, grows, or dies. I thought that’s what you recommended doing? Navmesh cutting for it was too much of a performance hit since it loops over everything and performs checks on them. For 20k+ objects it was around 9ms per frame I think with navmesh cuts when nothing changed.
Ah. I see.
Yeah then I think we should be able to get at least descent performance out of this.
The actual tile recalculation happens in a separate thread, so that shouldn’t be a problem (other than that no pathfinding will be done when it happens). The flood fill will in this case also be done in a separate thread, so it will also just increase the duration during which pathfinding is paused.
So I think the time on the main thread consists mainly of figuring out which objects are inside that tile and possibly converting some of them to meshes (sphere colliders, capsule colliders and terrains need to be converted to meshes before they can be rasterized).
Then there is some time that will be spent on connecting the tile to the rest of the nodes, but I think it is more likely that the mesh collecting code is the slow part.
If you enable the profiler you should see some labels called “UpdateAreaInit” and “CollectMeshes”, “RemoveConnections” and “Connect With Neighbours”. Check how long each one takes.

Ah. I see that I had used a custom profiler for that code.
You can make them show up if you open the UpdateAreaInit method in the RecastGenerator.cs file and change
AstarProfiler.StartProfile
to
Profiler.BeginSample
and
AstarProfiler.EndProfile
to
Profiler.EndSample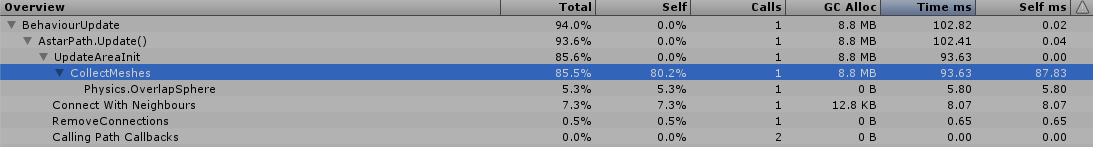
There we go. So it does seem like finding the meshes in the slow part.
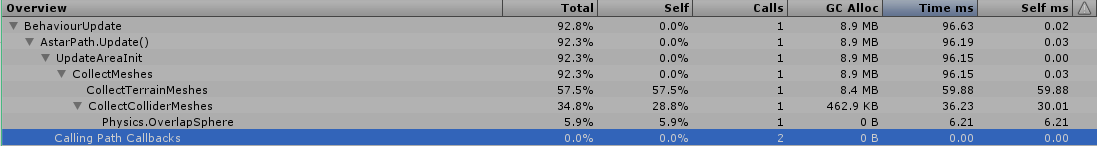
Try to add some profiling code to the various method calls in RecastGraph.CollectMeshes.
I would suspect that the call to
meshGatherer.CollectTerrainMeshes
is the slowest one, but it’s hard to know for sure as it depends on the scene.
Would the performance of this be better if the terrain was a mesh and had a mesh collider? Eventually we intend to replace our Unity terrain with a mesh based terrain. I imagine that would then add to the CollectColliderMeshes time though.
Lets see if this improves performance.
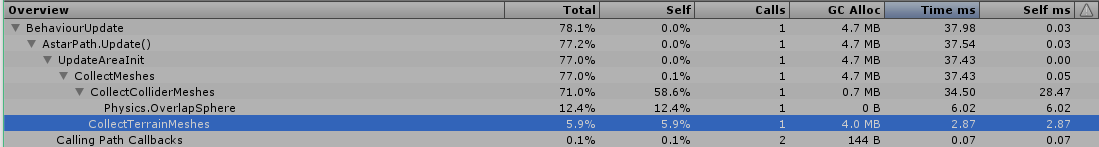
In the RecastMeshGatherer class, find the GenerateTerrainChunks method and replace the loop with this
for (int z = 0; z < heightmapDepth; z += chunkSizeAlongZ) {
	for (int x = 0; x < heightmapWidth; x += chunkSizeAlongX) {
		var width = Mathf.Min(chunkSizeAlongX, heightmapWidth - x);
		var depth = Mathf.Min(chunkSizeAlongZ, heightmapDepth - z);
		var chunkMin = offset + new Vector3(z * sampleSize.x, 0, x * sampleSize.z);
		var chunkMax = offset + new Vector3((z + depth) * sampleSize.x, sampleSize.y, (x + width) * sampleSize.z);
		var chunkBounds = new Bounds();
		chunkBounds.SetMinMax(chunkMin, chunkMax);

		// Skip chunks that are not inside the desired bounds
		if (chunkBounds.Intersects(bounds)) {
			var chunk = GenerateHeightmapChunk(heights, sampleSize, offset, x, z, width, depth, terrainSampleSize);
			result.Add(chunk);
		}
	}
}So that improved the performance by quite a bit, and cut allocations in half about. Is there anything you can do to further optimize CollectColliderMeshes as well?
I also noticed “Recalculate Connected Components” in a separate frame from this one at around 44ms this time I think. Hadn’t seen that previously, but probably just never looked at frames after the update. This is the flood fill, right? Would it still be showing in the profiler if it was running in a separate thread?
I just uploaded version 4.0.9 which includes the fix above as well as some additional optimizations to bring down the allocations of the CollectTerrainMeshes method.
I haven’t done much with the CollectColliderMeshes method, it’s harder to optimize. You can try to reduce the collider detail in the recast graph settings. That might help if that is a bottleneck.
Only if the mesh was divided into smaller chunks (roughly the size of a tile or some small multiple of that size). Otherwise when updating a single tile it will be forced to consider a much larger chunk of the terrain.
I’m still having performance issues updating the nav mesh at runtime. Is there anything you can do to fully multi-thread updating it, or at least split it across more frames so it’s less of a hit?
Possibly. It might take a bit of time though.
It might be relatively easy to spread it over several frames though.
Open the WorkItemProcessor.cs script and find the ProcessWorkItems method.
Find the line which looks like
workItems.Dequeue();
and change that to
workItems.Dequeue();
// Wait a frame with processing the remaining work items
workItemsInProgressRightNow = false;
return false;
I haven’t tested it, but I think it should cap the number of work items (i.e tiles that are updated) to 1 tile per frame. You may want to tweak it a bit if that turns out to make the calculations take too many frames.