NavmeshCut Performance

Okay I’ll give some of that a try and see if I can get acceptable performance with a layered grid graph instead, thanks.

My only issue I had when I tried to do a layered grid graph previously though was that if I have two separate objects that are on a walkable layer, and one object is on top of the other, then it still treats the area under that object as walkable. If I enable collision testing on that walkable layer then it like marked everything as not walkable. Is there a way to fix that?

The flood fill fix above was meant to be used with the recast graph. But it can of course be used with a layered grid graph too.

So I tried a test scene for a layered grid graph, mostly just a flat plane so not a truly accurate test, but set it to 2k and changed the restriction for max size to 2k, and performance wise it took 40 seconds to scan the graph. This is in the editor, so I assume it’d be less in a build. If there’s an async way to do that scan like recast (haven’t checked yet), then that should be fine probably. The memory requirements are quite a bit higher, like an extra 500-700MB I think, but that might be acceptable for better performance. Still a simple test, but calculating a path so far has been on average 0ms according to the logs, and sometimes going up to 2.5ms or so.

This might be an acceptable solution if I can figure out the problem I mentioned above for overlapping walkable layer objects.

Use ScanAsync like with the recast graph (just make sure you are using 4.0.3 or higher, there was a bug earlier that caused the layered grid graph not to work well with ScanAsync).

I think you should try out the flood fill fix on a recast graph first.

I can give that a try, but I’m slightly worried about what you said of increased path times, and not being able to use that method for IsPathPossible. I’m not currently using it, but I could maybe eventually.

Well after trying out the layered grid graph in a real scene, it took much longer to finish and used 2 GB of memory, so it isn’t an option.

Would it be possible to get an additional field added to the tile handler for max number of tiles to update per tick? That way we can set things like update every frame, but no more than a couple tiles at a time. Would something like that help with the performance of it?

That might be doable.

To start with you could try to log how many tiles it is actually updating per tick. It should be fairly easy to log this in the TileHandler.EndBatchLoad method. Simply loop through the reloadedInBatch array and count the number of entries set to true.

You could also add some profiling code to the FloodFill method in the AstarPath class and then use the Unity profiler to see what is taking up the most time (there is already profiling code added for other parts of the navmesh cutting code).

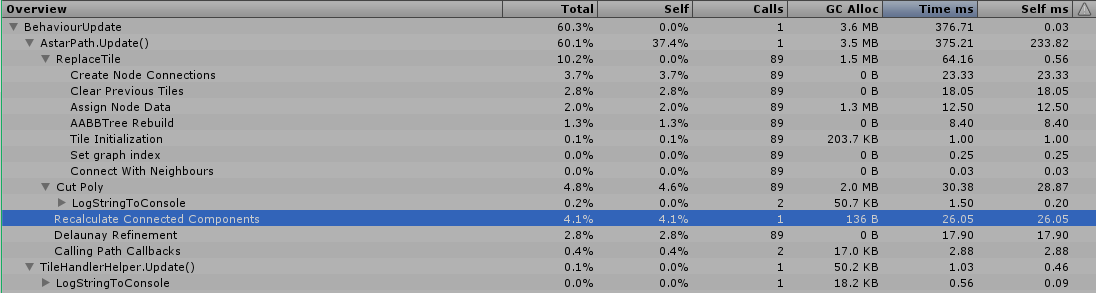
Okay so the batch counts have been between 80-100 for majority of them.

Here’s the profiler for it

I haven’t noticed these warnings before, not sure if it’s related or not, but got quite a few of them

Skipping degenerate triangle.
UnityEngine.Debug:LogWarning(Object)
Pathfinding.Util.TileHandler:CutPoly(Int3[], Int32[], Int3[], GraphTransform, IntRect, CutMode, Int32) (at Assets/AstarPathfindingProject/Generators/Utilities/TileHandler.cs:540)
Pathfinding.Util.c__AnonStorey1:<>m__0(IWorkItemContext, Boolean) (at Assets/AstarPathfindingProject/Generators/Utilities/TileHandler.cs:1213)
Pathfinding.WorkItemProcessor:ProcessWorkItems(Boolean) (at Assets/AstarPathfindingProject/Core/Misc/WorkItemProcessor.cs:243)
AstarPath:PerformBlockingActions(Boolean) (at Assets/AstarPathfindingProject/Core/AstarPath.cs:803)
AstarPath:Update() (at Assets/AstarPathfindingProject/Core/AstarPath.cs:787)

KeyNotFoundException, perturbating vertices slightly.
This is usually fine. It happens sometimes because of rounding errors. Cutting will be retried a few more times.
UnityEngine.Debug:LogWarning(Object)
Pathfinding.Util.TileHandler:CutPoly(Int3[], Int32[], Int3[], GraphTransform, IntRect, CutMode, Int32) (at Assets/AstarPathfindingProject/Generators/Utilities/TileHandler.cs:705)
Pathfinding.Util.c__AnonStorey1:<>m__0(IWorkItemContext, Boolean) (at Assets/AstarPathfindingProject/Generators/Utilities/TileHandler.cs:1213)
Pathfinding.WorkItemProcessor:ProcessWorkItems(Boolean) (at Assets/AstarPathfindingProject/Core/Misc/WorkItemProcessor.cs:243)
AstarPath:PerformBlockingActions(Boolean) (at Assets/AstarPathfindingProject/Core/AstarPath.cs:803)
AstarPath:Update() (at Assets/AstarPathfindingProject/Core/AstarPath.cs:787)

PointOnEdgeException, perturbating vertices slightly.
This is usually fine. It happens sometimes because of rounding errors. Cutting will be retried a few more times.
UnityEngine.Debug:LogWarning(Object)
Pathfinding.Util.TileHandler:CutPoly(Int3[], Int32[], Int3[], GraphTransform, IntRect, CutMode, Int32) (at Assets/AstarPathfindingProject/Generators/Utilities/TileHandler.cs:691)
Pathfinding.Util.TileHandler:CutPoly(Int3[], Int32[], Int3[], GraphTransform, IntRect, CutMode, Int32) (at Assets/AstarPathfindingProject/Generators/Utilities/TileHandler.cs:692)
Pathfinding.Util.c__AnonStorey1:<>m__0(IWorkItemContext, Boolean) (at Assets/AstarPathfindingProject/Generators/Utilities/TileHandler.cs:1213)
Pathfinding.WorkItemProcessor:ProcessWorkItems(Boolean) (at Assets/AstarPathfindingProject/Core/Misc/WorkItemProcessor.cs:243)
AstarPath:PerformBlockingActions(Boolean) (at Assets/AstarPathfindingProject/Core/AstarPath.cs:803)
AstarPath:Update() (at Assets/AstarPathfindingProject/Core/AstarPath.cs:787)

Looks like relatively evenly spread out CPU usage unfortunately.
What is surprising however is that AstarPath.Update takes 375 ms, but only 140 ms of them are accounted for by the groups below. So something is taking around 230 ms to do that frame, but we don’t know what it is.

Also. 80-100 tile updates. That is a lot. Are all your moving navmesh cuts very spread out in the world. If not you might want to increase the tile size (really this is just a gut feeling, that could just as well make it take longer. It is very hard to predict).

Those warnings are annoying, but I don’t think they should cause any trouble (unless you really are getting a lot of them, in which case I would try to look for e.g navmesh cuts that have been rotated incorrectly so that they are only a single flat plane instead of a volume (can only happen if ‘useRotationAndScale’ is enabled). They are logged when two navmesh cuts happen to share a vertex or edge with either the existing navmesh or each other. If that happens it has to try again after having moved the navmesh cuts around randomly a tiny amount (it doesn’t actually move the transform though, just the internal representation for just that tile).

It’s for 100 moving objects that are pretty much evenly spaced out on the terrain. That’s kinda why I asked if we could limit the max number of tiles per batch. Then do it every frame, but only maybe 2-3 per frame. So then basically every tile gets updated at least once a second perhaps.

Eventually it’d probably be more than 100 at a time if I can get decent enough performance to handle it. Basically trying to have the creatures not walk through each other or players either, and since local avoidance is more just to stop clipping than navigate around, it seems this is the only option.

It was a lot of warnings, like in the hundreds for some of them. I didn’t have any nevmesh cuts that had rotation/scale enabled in that test.

I just uploaded v4.0.6 which fixes this.

Okay thanks. Which way should I do it now, add the TileHandler before or after the scan?

Any order will work (at least that’s the theory, I did test a bunch of different cases, but it’s always possible that I missed some case).

Would it be possible to add a field for the max number of tiles to redo per frame with graph updates as well? I’m having too much of a performance hit if a lot of trees get destroyed/created around the same time.

It seems like graph updates generate A LOT of garbage as well. I’m getting on average about 90ms for graph updates, and 9mb of allocations. Is there anything I can do about this? It’s making it pretty much unusable once trees start dying out and getting replaced.

So I had assumed the performance was so bad because I was probably updating multiple tiles in one frame. Well I changed my code so that I only try to grow at most one tree per frame (12.5 times per second at the moment), and just spread it instead of batched together. My performance is still the same. This is running in the Unity editor though, so it might be better in a build. The allocations I imagine wouldn’t be though. Are these numbers accurate? Should it be taking this long to update one tile?

I also added in the return to the FloodFill method like you suggested, and it had no effect. The numbers are still the same.

Possibly, but it is not as straight forward as it seems (if a navmesh cut is on the border between two tiles the two tiles should be updated at the same time for best results).

You are updating A LOT of tiles, but still, yeah navmesh cutting does generate a lot of garbage. The primary reason is that all nodes in tiles that are updated have to be replaced. Since already calculated paths can store references to node indefinitely, I cannot pool node objects even though I really would want to. There is still some refactoring I can do do pool some vertex and triangle arrays though.

In the profiler screenshot above there is a large chunk of time that is unaccounted for. I haven’t been able to replicate that result though. Do you think it would be possible for you to try to see where that is coming from? Possibly by enabling deep profiling.

If you check the profiler, the time for ‘Recalculate Connected Components’ should now be zero. This may or may not be significant, but it would grow the larger the graph was.

The profiler shot I showed you above was for navmesh cutting with lots of tiles being affected. I’ve disabled that currently because it was unusable for me at that performance, sorry for the miscommunication. Everything recently has been in relation to just manual graph updates. FloodFill being disabled seemed to have no performance affect. It’s 90ms and 9mb for just one tile updated per frame.

Anytime I try and enable deep profiling Unity crashes. I believe it’s a bug with Unity that they haven’t fixed yet.

Oh, so no navmesh cutting at all?