The Gizmo display is really bad, and what’s worse is the fact the gizmo display code is being executed, even when no graph-display options are enabled.
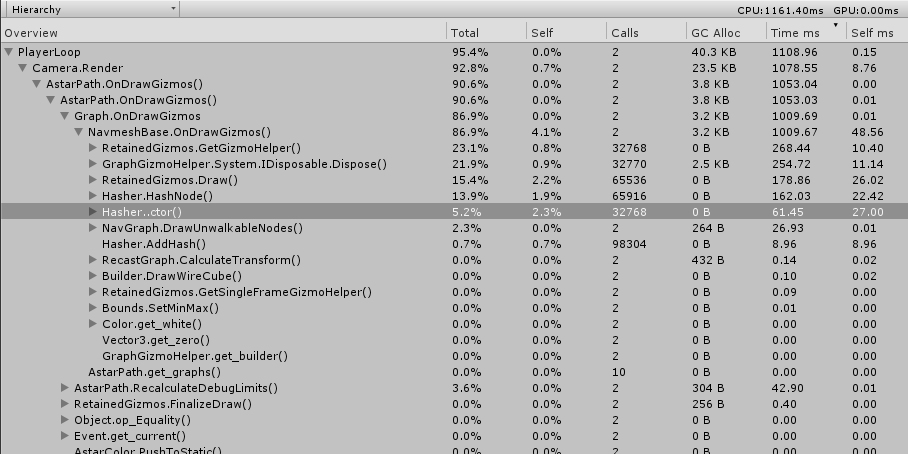
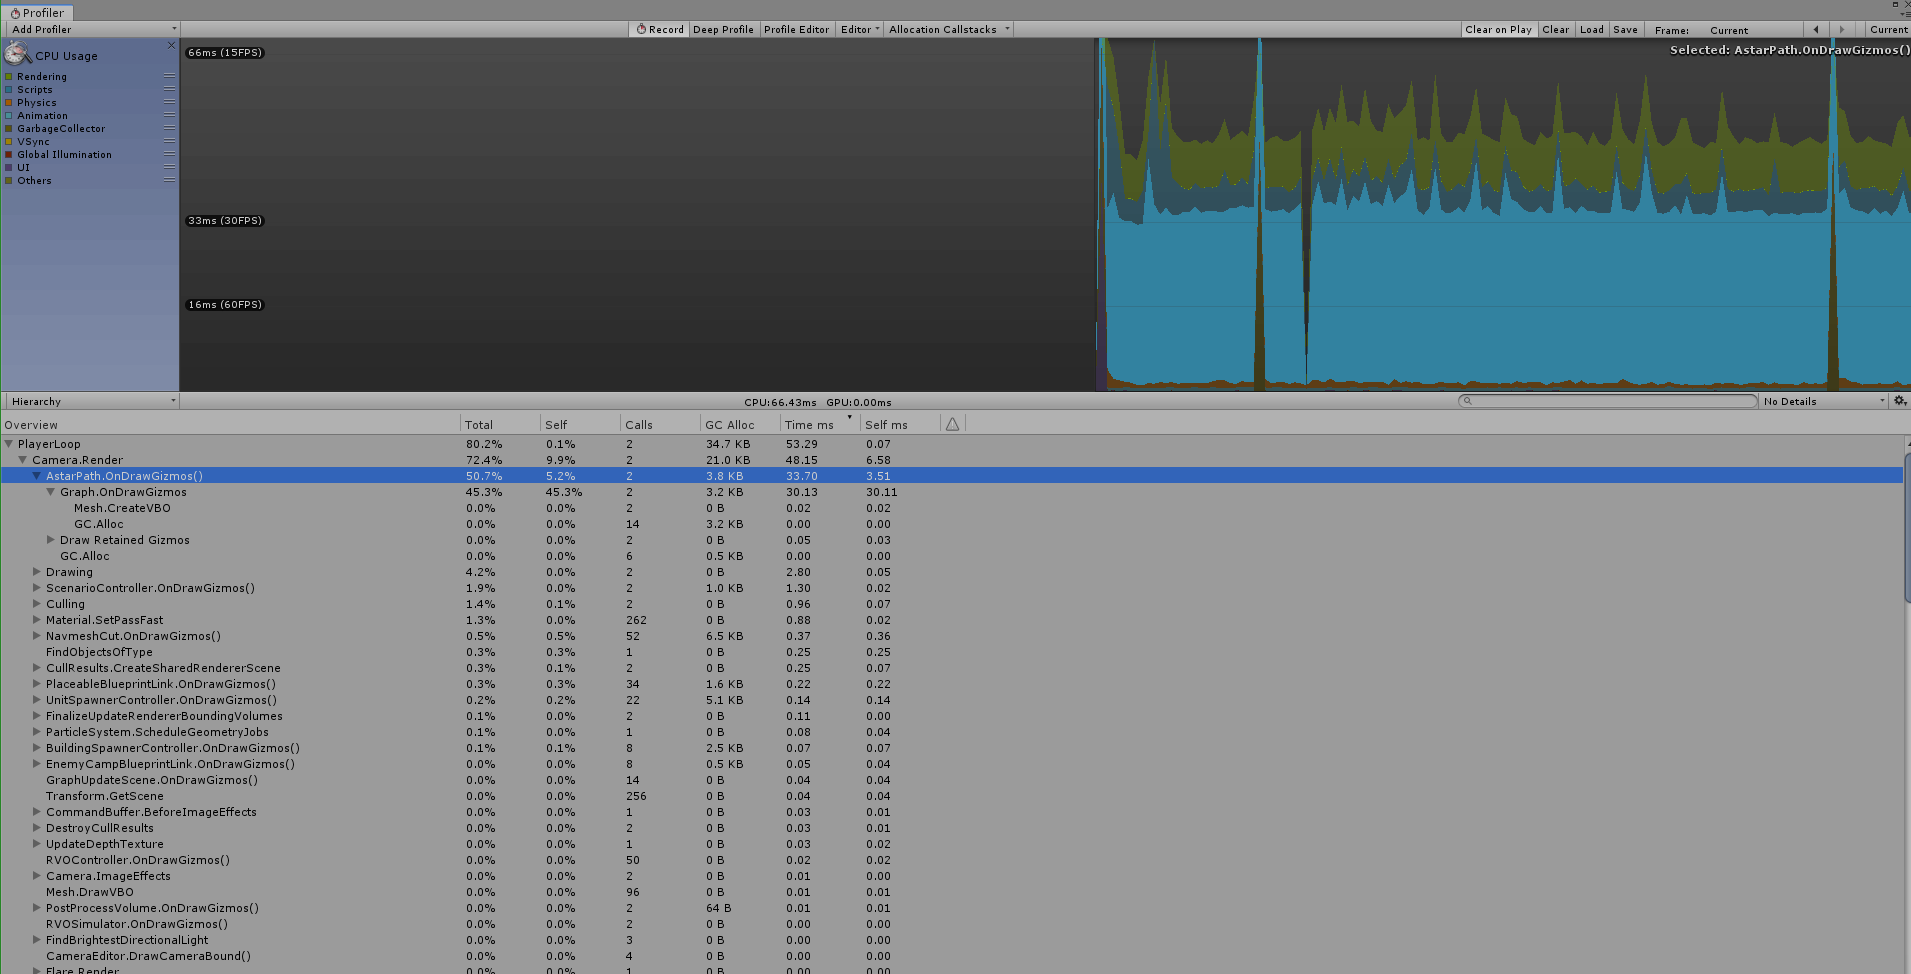
If I enable Gizmo in game view I get this massive performance drop (this is already with huge optimization I did for Hasher):
The performance is still unacceptable, but it just show how much work the code needs and how much improvement can be gained with just few simple improvements.
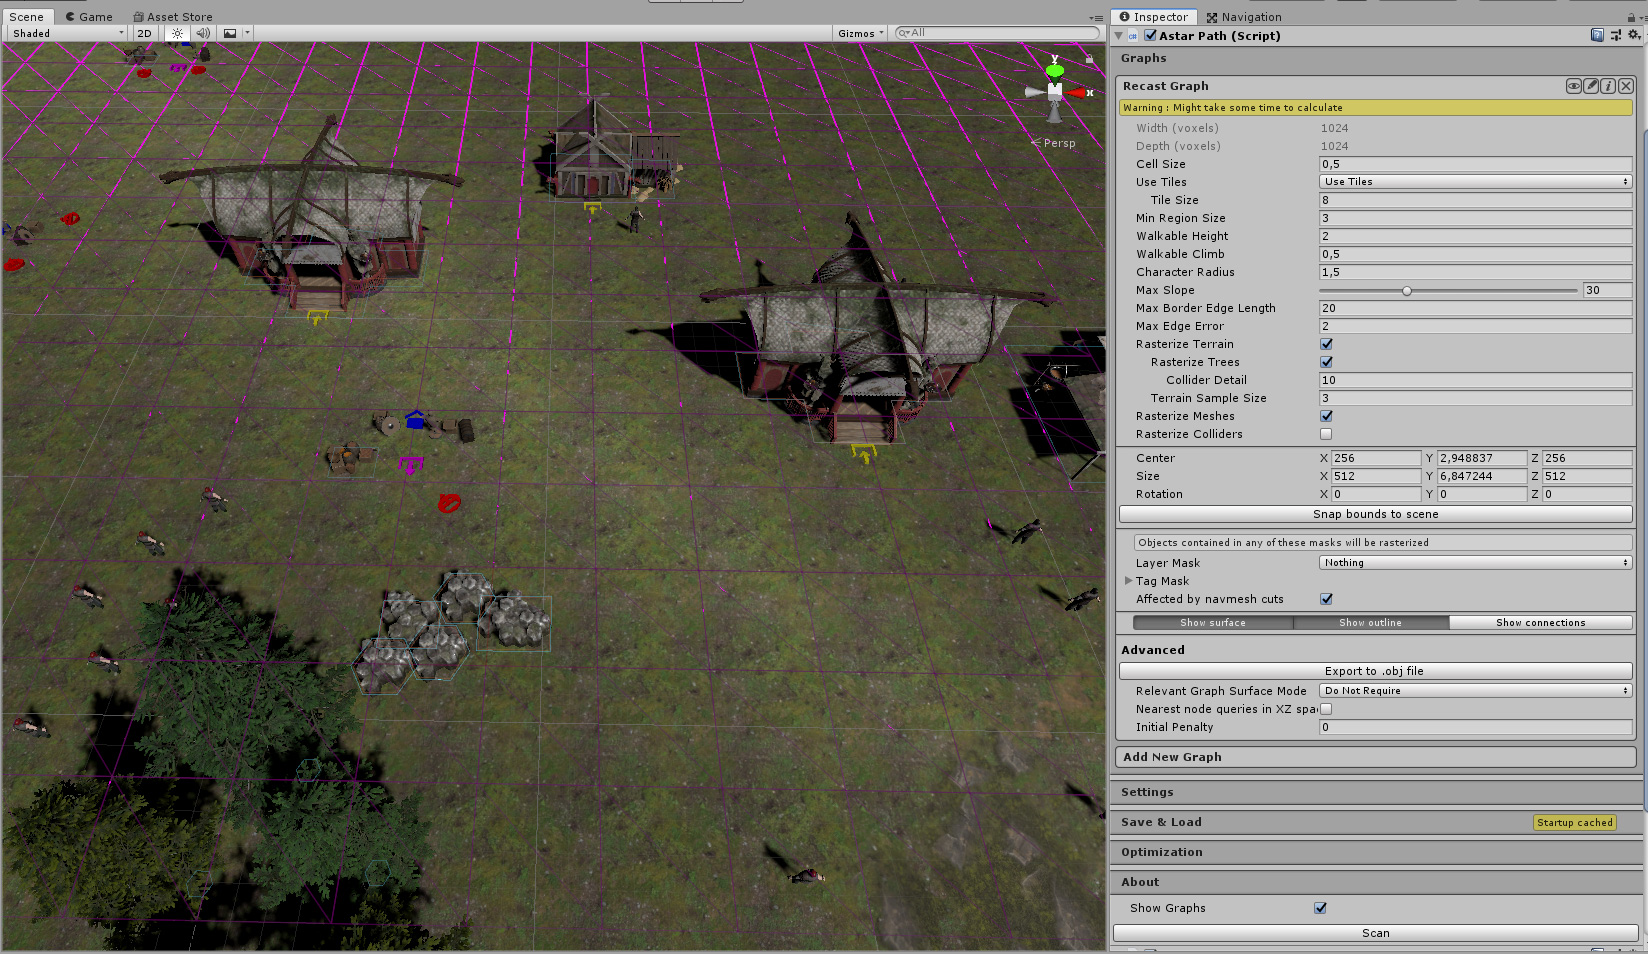
Just out of curiosity. Do you think you could post a screenshot of your graph?
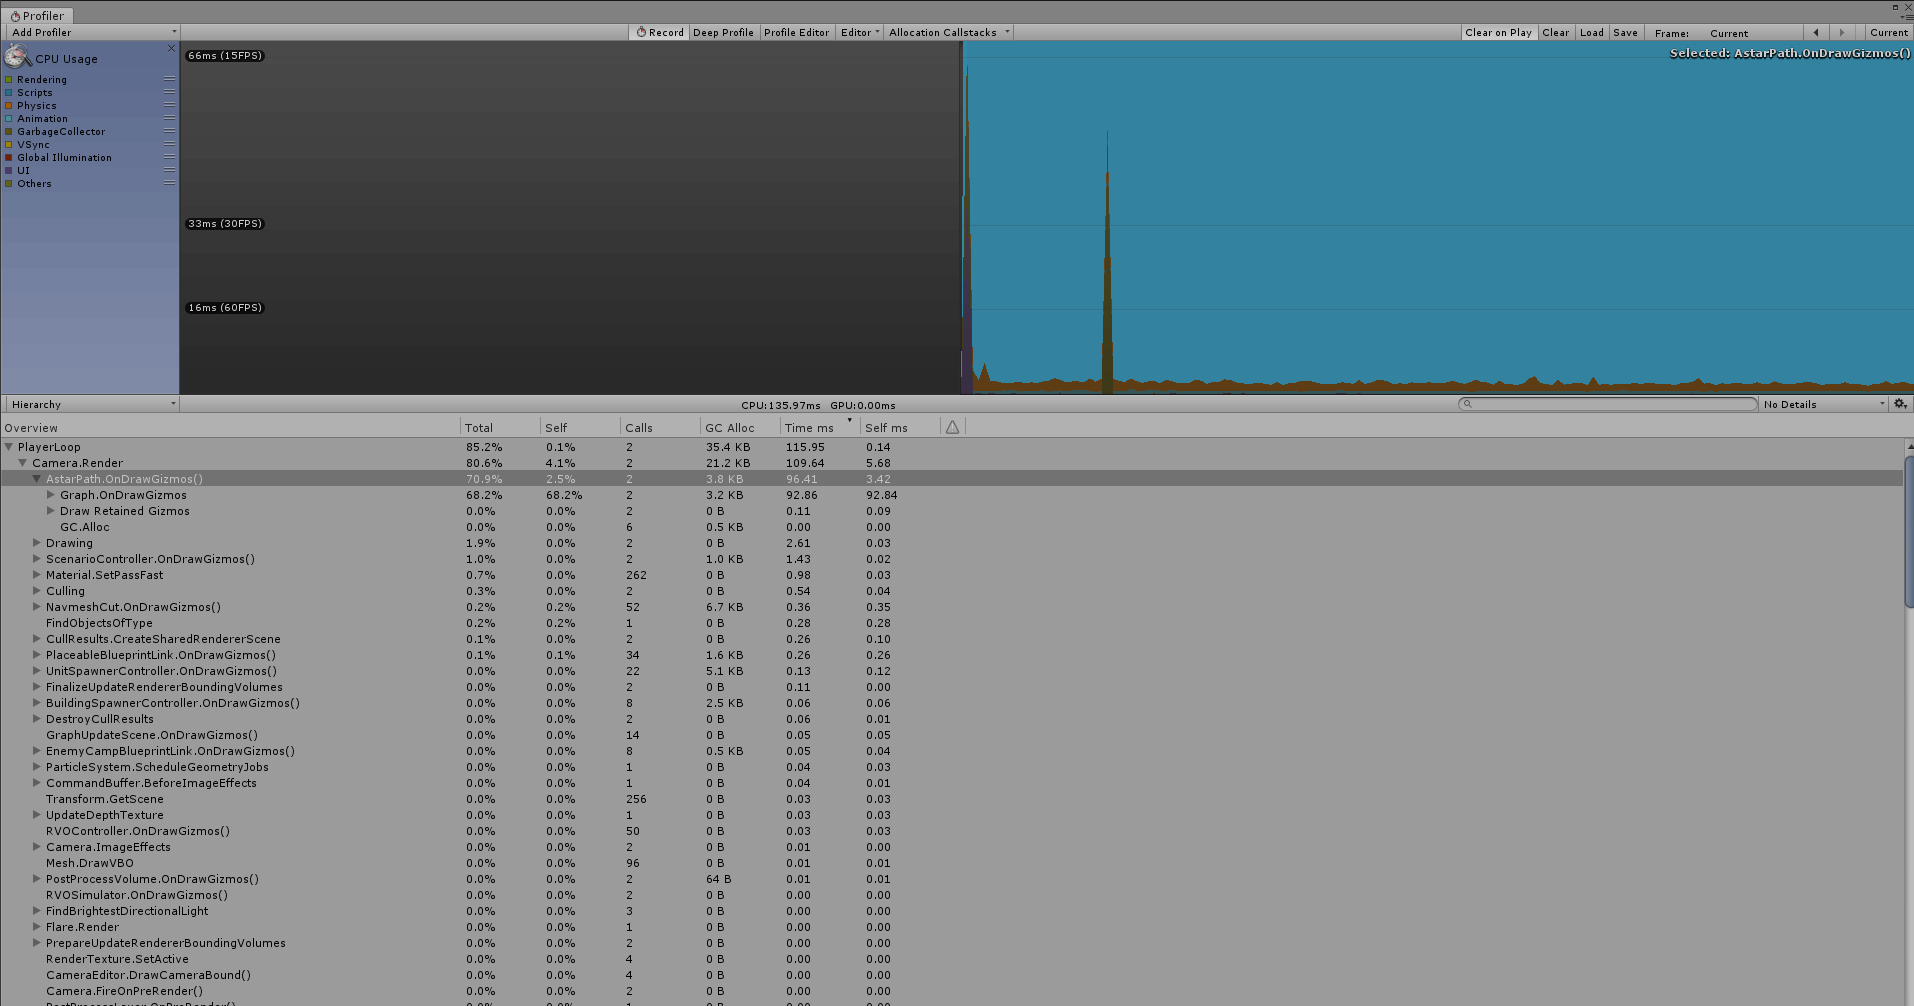
Also. Do you think you could post a profiling result when you are not using deep profiling (as deep profiling slows things down by an extreme amount in most cases)?
You are right that it is currently slow when the recast graph has a huge number of small tiles.
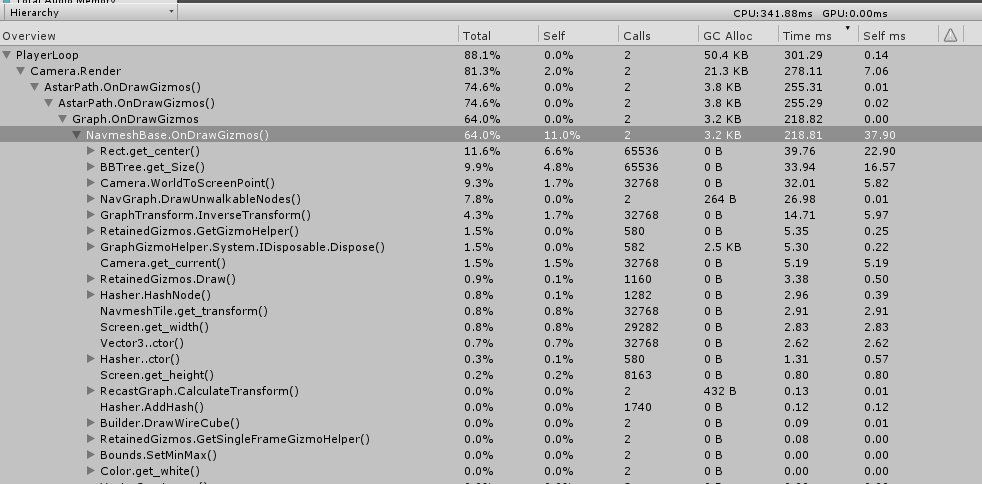
I have done some optimizations for that now (not the same as yours though as those break a lot of things (the user may change the colors and the gizmos can be visible from multiple cameras and unfortunately nothing can be assumed about the bounding box of the tile along the y coordinate). I managed to get around a 15x speedup in my test case. Performance when the tiles are large is pretty much unchanged.
Just tried the new version and it’s much better, thank you!
I general I noticed a lot of problems stems from the fact that GetHashCode is recalculated every call using modifiable member data. This is incorrect, as the hash code should be immutable.
Thanks again for help.
I hope you can take a look at some point at the other problem I reported with GraphSceneUpdate’s here:
The gizmo drawing code uses a hash of the node to be able to detect if anything has changed. Nodes are not immutable and neither is that hash. You are correct that the C# GetHashCode function is generally immutable, however the GetGizmoHashCode function that is used here is simply a hash, it doesn’t have to be immutable.
This hashing is done for performance to avoid having to recalculate all visualizations every frame. Instead it can just check “has the graph changed? recalculate the visualizations, otherwise just use the one from the previous frame”.
That’s clear, yet with each GetGizmoHashCode calculation, there are actually some heavy match calculations, and performance impact is leaner to total count of nodes and connections in the graph.
One could imagine the hash have to be recalculated only when actually some data has changed, rather than every frame for every node .
Sure. But a user’s script can change the graph data at any time and making every single data member a property would have other performance implications as well as being error prone. I cannot just assume it only changes due to e.g. graph updates (even though that is the case most of the time). I have no choice but to validate it every frame. With these changes it should be performant enough in any case.
 .
.